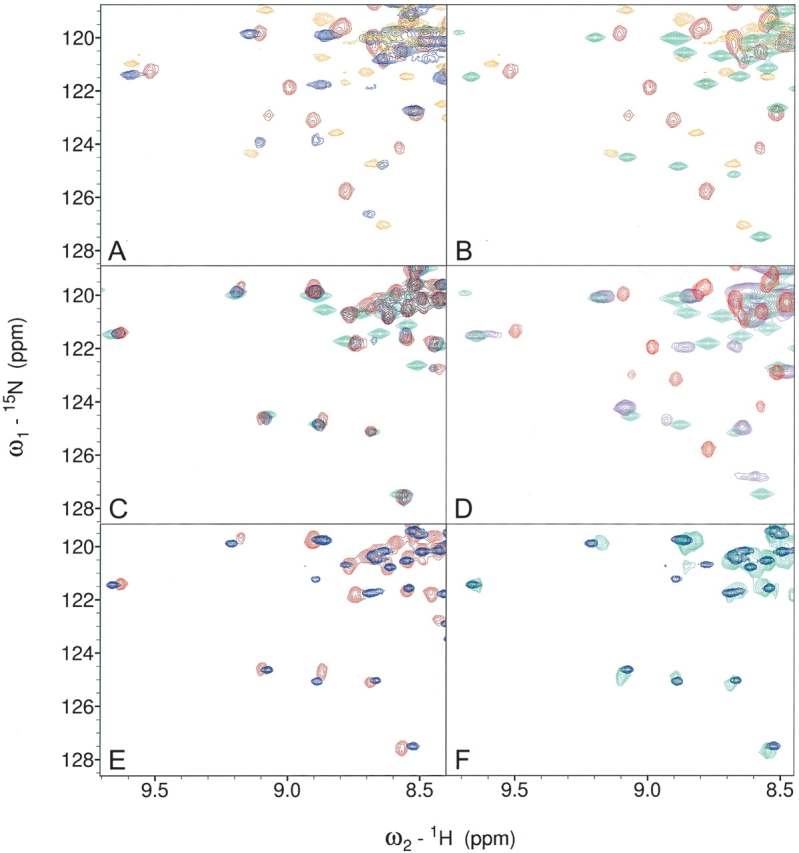
Figure 3.

HSQC fingerprints of FAT–LD complexes. The spectra shown are the “fingerprint” regions that highlight the differences between the FAT domain bound to one or two peptides and the monomer–dimer shift. Full spectra are available in the supplemental data section. (A) FAT (red), FAT + LD2 1:1 (blue), and FAT + LD4 1:1 (orange); (B) FAT (red), FAT + LD2 1:10 (green), and FAT + LD4 1:1 (orange); (C) FAT + LD2 + LD4 1:1:1 (red), FAT + LD2 + LD4 1:10:1 (blue), and FAT + LD2 1:10 (green); (D) FAT (red), FAT–LD2 (purple), and FAT + LD2 1:1 (green); (E) FAT + LD2 + LD4 1:1:1 (red) and FAT–LD2 + LD4 1:1 (blue); (F) FAT–LD2 + LD4 1:1 (blue) and 15N FAT in a complex with unlabeled paxillin residues 128–308 (green).
