
Fig. 3.
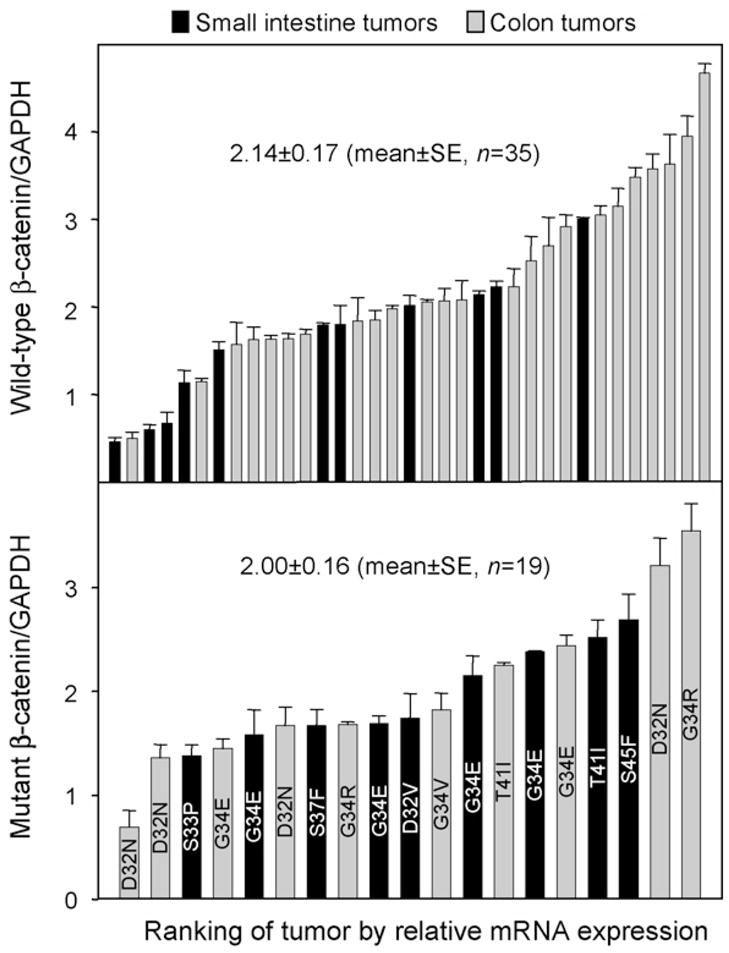
β-Catenin mRNA expression varies markedly in DMH-induced tumors. Each tumor was screened by qPCR, and β-catenin mRNA expression was normalized to the corresponding levels for GAPDH. Data bars (mean ± S.E., n = 3) were arranged from lowest to highest mRNA expression for small intestine tumors (black bars) and colon tumors (gray bars), and according to whether β-catenin was wild type (upper panel, n = 35) or mutant (lower panel, n = 19). The lower panel also shows each amino acid substitution identified in β-catenin (e.g. D32N).