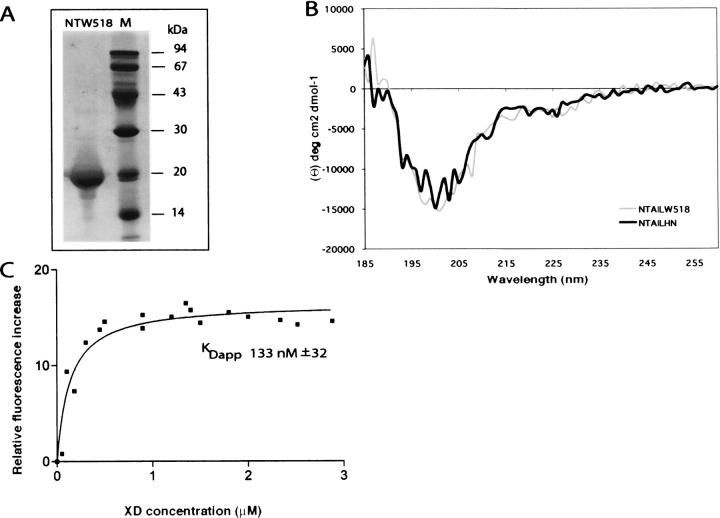
Figure 6.
(A) Purification of NTAILW518 from E. coli. Coomassie blue staining of a 12% SDS-PAGE. Purified NTAILW518 protein. (B) Far-UV CD spectra of NTAILHN and NTAILW518. The spectra were recorded on a 0.1 mg/mL protein solution in 10 mM sodium phosphate (pH 7) at 20°C, and represent the mean of three independent acquisitions. (C) Fluorescence spectroscopy studies of NTAILW518. The relative fluorescence increase of NTAILW518 (1 μM in 10 mM sodium phosphate at pH 7) is plotted as a function of the XD concentration. The KDapp value (see text) results from the fitting of the data to a single exponential.

