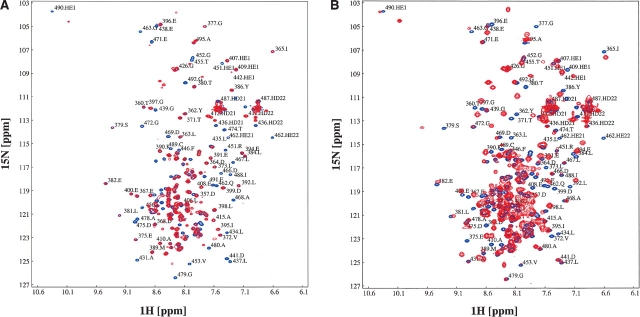
Figure 6.
Titration of NusACTD with αCTD and λN(1–53). (A) Interaction of NusACTD with αCTD. 15N-labeled GP-NusA(339–495) was titrated with unlabeled αCTD until no further changes were observed in the spectra, resulting in a NusACTD:α CTD ratio of 1:2.1. Shown are the overlays of the 1H15N-HSQC spectra at 700 MHz of the end points of the titrations, corresponding to the free (blue) and complexed (red) NusACTD. (B) Interaction of NusACTD with λN(1–53). 15N-labeled GP-NusA(339–495) was titrated with λN(1–53) until no further changes were observed in the spectra, resulting in a NusACTD: λN(1–53) ratio of 1:3.4. Shown are the overlays of the 1H15N-HSQC spectra at 700 MHz of the end points of the titrations, corresponding to the free (blue) and complexed (red) NusACTD.

