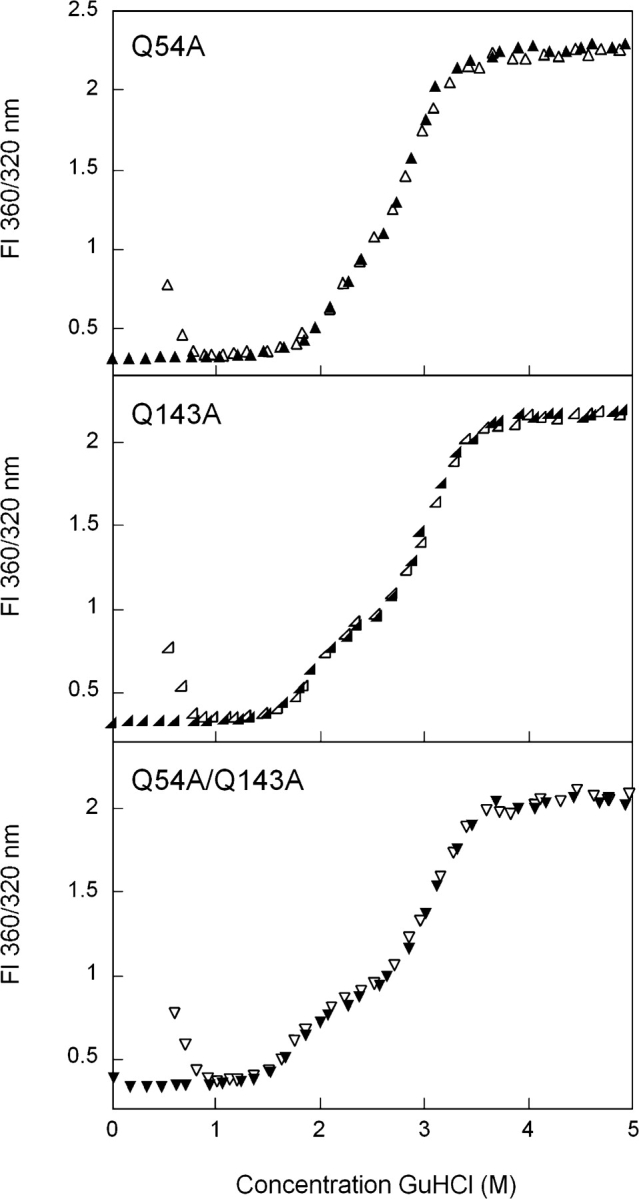
Figure 6.

Equilibrium unfolding/refolding of Q54A (▴), Q143A (◂), and Q54A/Q143A (▾) HγD-Crys in GuHCl probed by fluorescence emission. The unfolding transitions are shown as closed symbols; the refolding transitions as open symbols. Data was analyzed by fluorescence intensity at 360/320 nm using an excitation wavelength of 295 nm. Protein was present at 10 μg/mL in 10 mM sodium phosphate, 5 mM DTT, 1 mM EDTA (pH 7.0), and GuHCl from 0–5.5 M at 37°C, with a 24-h equilibration time.
