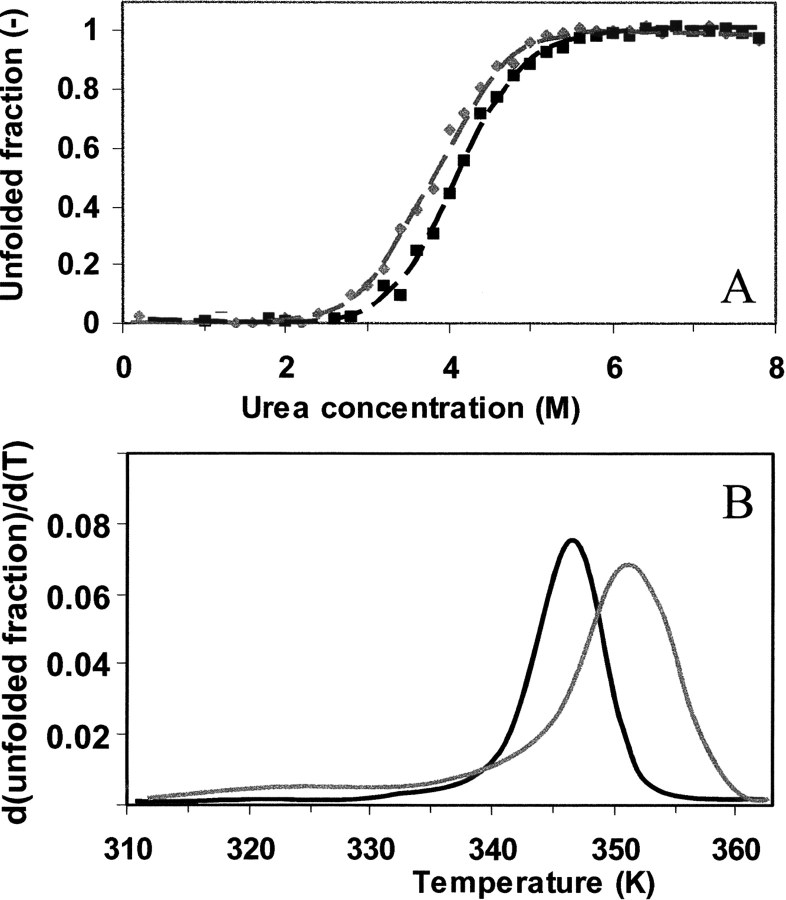
Figure 3.
Evaluation of protein conformational stability. (A) Urea denaturation equilibrium study of nonmodified (black) and glucosylated (gray) β-lactoglobulin A as monitored by the tryptophan fluorescence at 320 nm as a function of the urea concentration at 20°C. The lines represent the fits of the two-state unfolding analysis of the data. (B) The CD intensity at 293 nm in the near-UV CD spectra is monitored as function of temperature for the two proteins. Upon reworking the observed intensities in terms of unfolded fraction and taking the derivative over temperature and subsequent smoothing, the curves presented in this panel are obtained.

