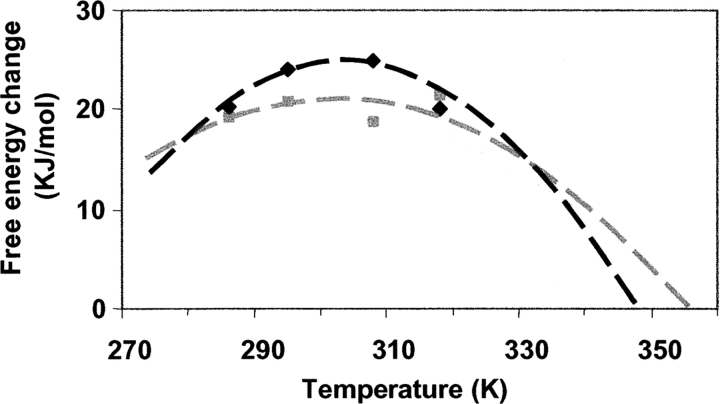
Figure 7.
Change in Gibbs energy as a function of temperature. The dashed lines (black for nonmodified, gray for glucosylated b-LGA) are the established curves according to the method of Greene and Pace (1974) using data obtained by DSC (ΔH for nonmodified and glucosylated β-lactoglobulin A [b-LGA] are 380 and 340 kJ/mol, with corresponding Tds of 346 and 351 K, respectively). Values for ΔCp (11.0 and 4.5 kJ/mol for nonmodified and glucosylated b-LGA, respectively, are established as described in this work). The symbols reflect experimental values for nonmodified (black) and glucosylated (gray) b-LGA as derived from equilibrium denaturant unfolding studies carried out at different temperatures.

