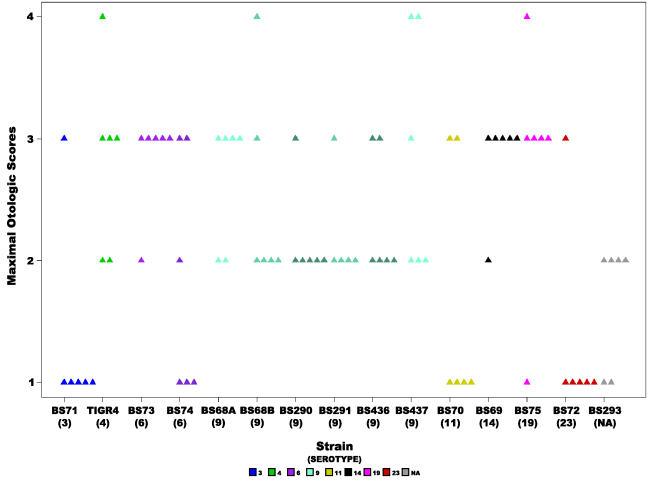
Figure 3. Severity of otoscopic change.
Scatter plot illustrating the maximal otologic score for each animal inoculated with each of the S. pneumoniae strains, where each triangle represents a single animal. Statistical analysis of all the strains revealed a significant difference (ANOVA p-value = 9.56e−5 and Kruskal-Wallis p-value = 0.00118). Colors represent different serotypes, and shades of the same color different strains of the same serotype or in the case of BS68(9) two cohorts from different experiments. NA: non applicable.

