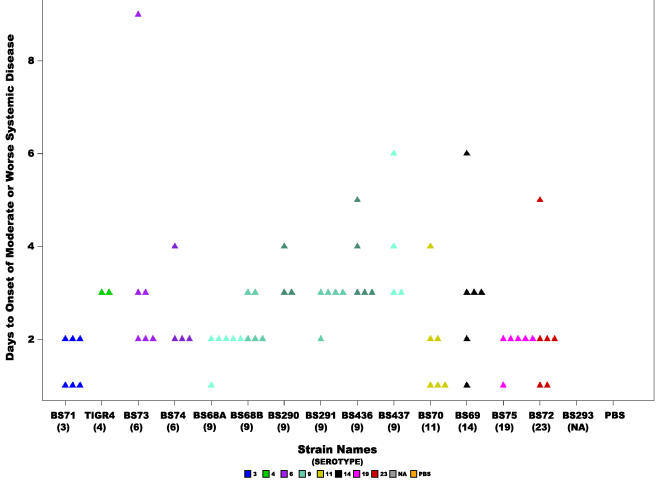
Figure 6. Rapidity of onset of moderate or worse systemic signs.
Scatter plot showing the number of days it took for chinchillas inoculated with each of the S. pneumoniae strains to develop moderate or worse signs of systemic disease (score ≥2). Statistical analysis of all the strains revealed a significant difference (ANOVA p-value = 0.03 and Kruskal-Wallis p-value = 0.00118). Each triangle represents a single animal. Animals were not included that did not develop systemic disease before the end of the experiment. Colors represent different serotypes, and shades of the same color different strains of the same serotype or in the case of BS68(9) two cohorts from different experiments. NA: non applicable.

