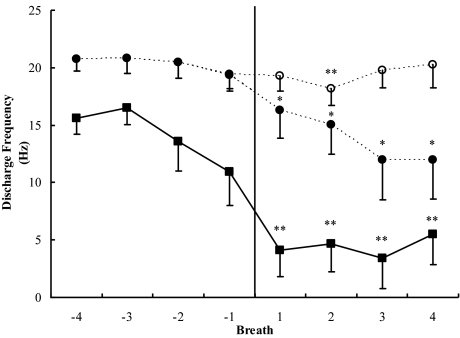
Figure 2.
The functions with solid symbols represent peak discharge frequencies of all inspiratory phasic (solid squares) and inspiratory tonic (solid circles) motor units before and after α-to-θ transitions. A value of 0 was entered when a unit ceased activity, and, thus, the data reflect the contribution of phasic motor units to overall muscle activity. The function with open symbols represents inspiratory tonic (open circles) units that continued to be active following the transition. Asterisks indicate that the posttransition value is significantly different from the mean of the pretransition values (*P < 0.05; **P < 0.01). Error bars indicate SEM.

