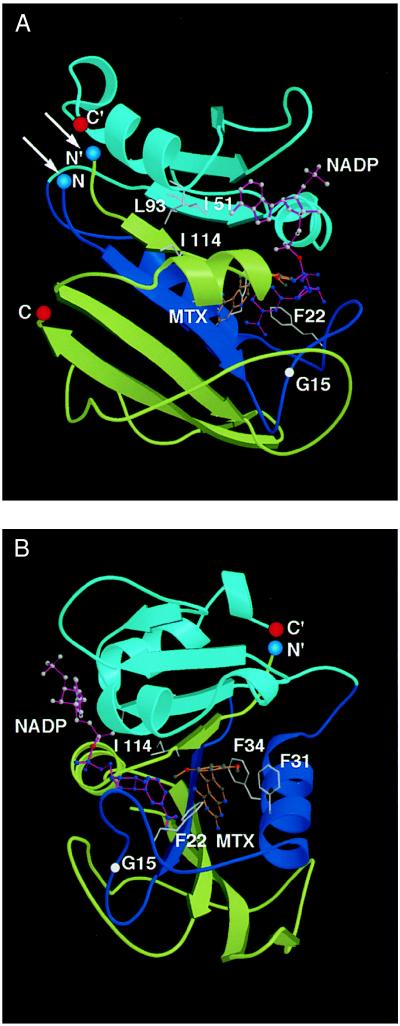
Figure 2.
Structure of hDHFR (32) showing fragments F[1,2] (blue-cyan) and F[3] (yellow) bound NADPH (violet) and methotrexate-γ-tetrazole (gold). (A) Natural and fragment N and C termini (N, C, and N′, C′, respectively) are indicated by blue or red circles. Arrows indicate location of fusion to oligomerizing proteins. Position of Ile-114 and contact residues in F[1,2] (Ile-51 and Leu-93) are indicated. (B) Ninety degree vertical axis rotation of view in A showing positions of methotrexate resistance mutations.

