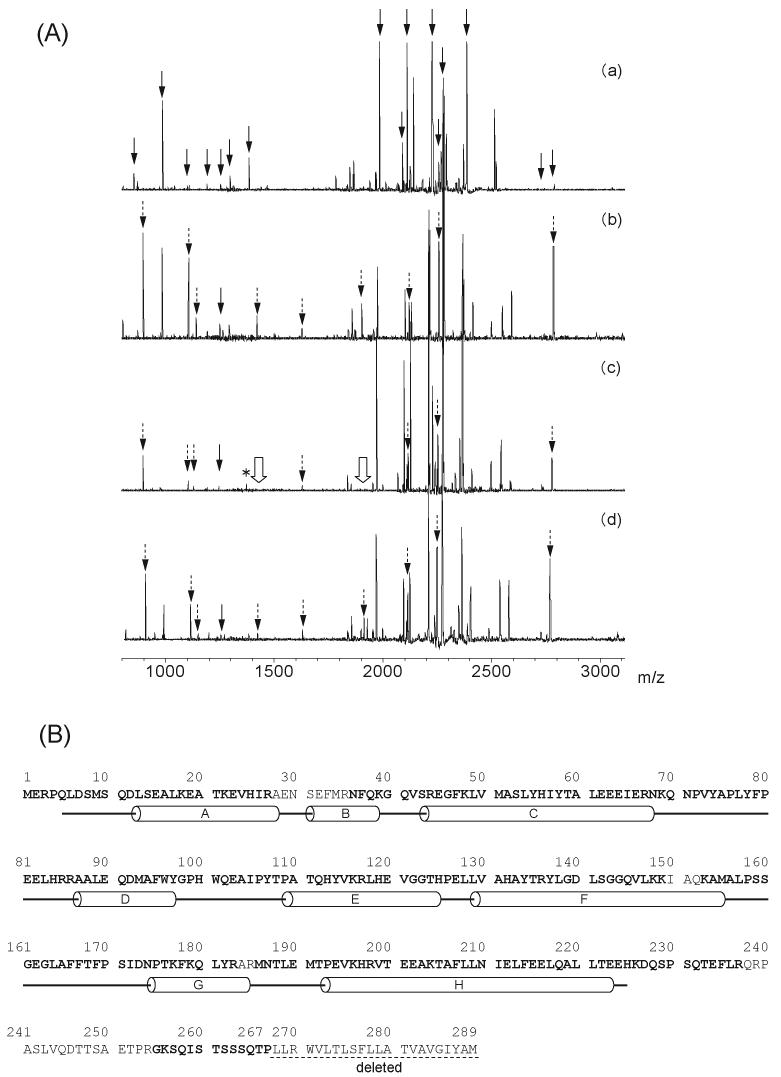
Fig. 2. Mass spectrometric analysis of the heme-rat HO-1 complex.
(A) MALDI-TOF mass spectra of the tryptic peptides from rat HO-1: (a) unmodified, (b) acetylated in the absence of the reductases, (c) acetylated in the presence of CPR, (d) acetylated in the presence of BVR. The 16 solid arrows in (a) indicate the positions of the peptide fragment derived from the unmodified HO-1. The dashed arrows, 9 in (b) and (d) and 7 in (c) indicate the peaks of the acetylated peptides. The single solid-line arrows at m/z 1249 in (b), (c) and (d) indicate the Tyr-137-Lys-148 peptide without acetylation. In (c), the peak at m/z 1377 (asterisk) indicates the Tyr-137-Lys-149 peptide without acetylation and the 2 hollow arrows indicate the peaks, m/z 1419 and 1902, which were not detected in HO-1 acetylated in the presence of CPR. (B) Sequence and secondary structure of rat HO-1. Identified amino acid sequences in the mass spectra from heme-unmodified rat HO-1 complex are indicated by bold characters. The α-helices are shown as cylinders.

