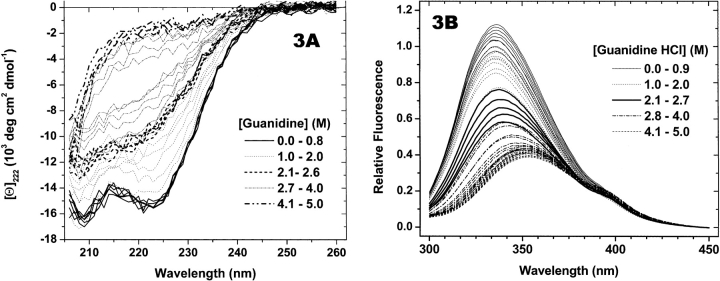
Figure 3.
RXR titration spectra. RXRα (1.4 μM monomer) was titrated with guanidine HCl, and spectra were collected as described in Materials and Methods. Heavy lines are spectra collected at the concentrations shown in the legends. Thin solid lines are spectra identified as pretransition and posttransition spectra. In the case of fluorescence spectra between 2.10 M and 2.71 M guanidine, identification was made on the basis of the behavior of CD spectra in that range. Thin dotted lines and dashed-dotted lines are spectra measured over the structural transitions. (A) CD spectra. (B) Fluorescence spectra.

