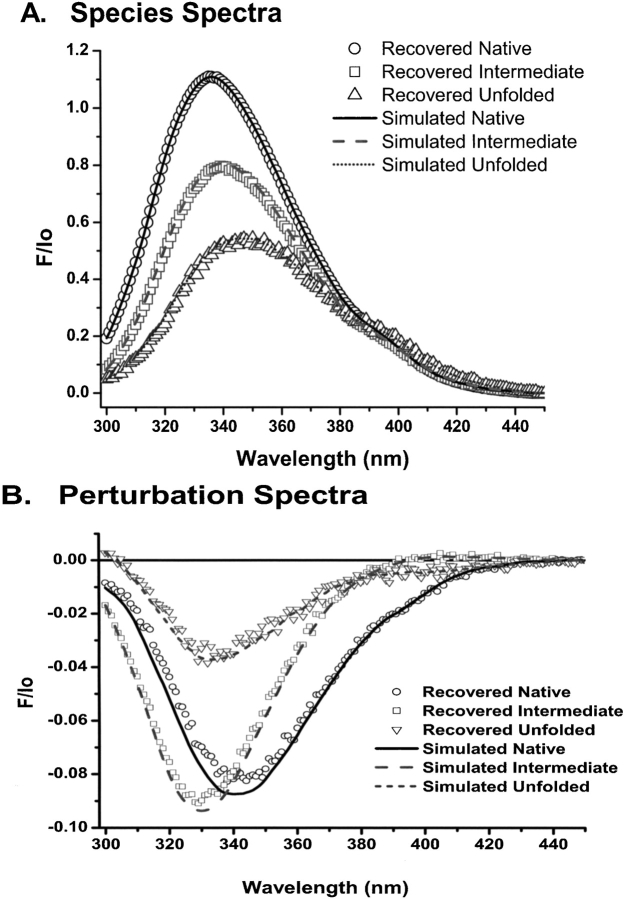
Figure 5.
Comparison of simulated and recovered three-state fluorescence spectra. The three species spectra and three perturbation spectra used to simulate a three-state titration are shown with line plots. A three-state model was fit to 32 simulated data sets with random noise as described in Results. The median parameter estimates were used to calculate expected spectra, shown as symbols. (A) Species spectra. (B) Perturbation spectra.

