
Figure 7.
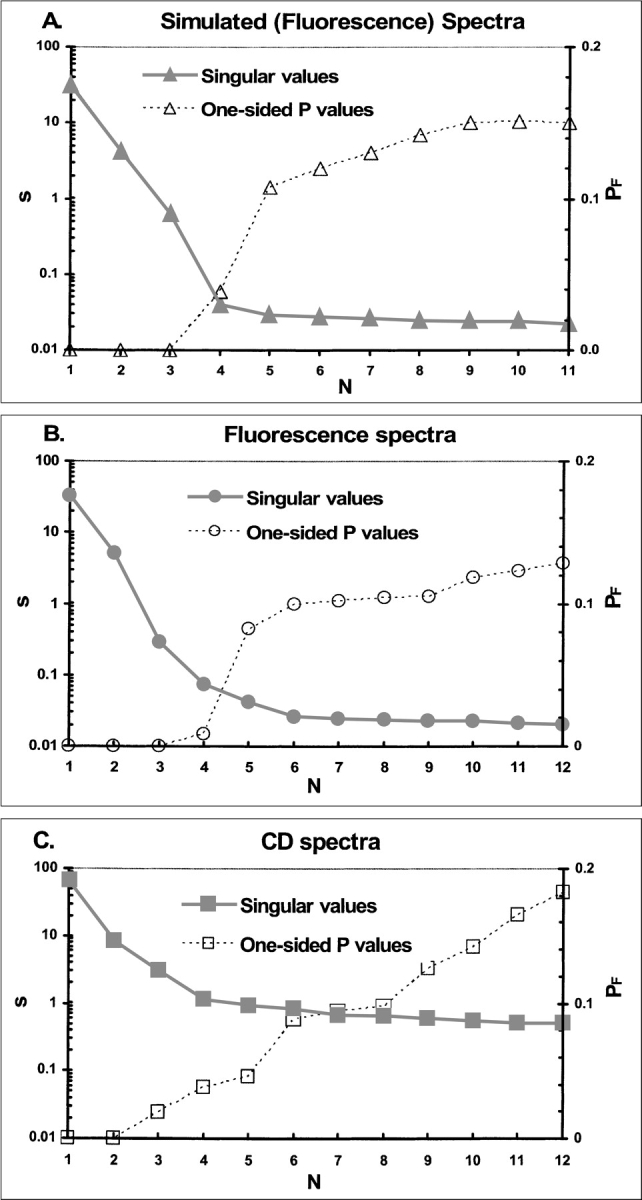
Singular value analysis of simulated and RXRα data. Logarithms of singular values from SVD of data matrices (solid symbols, solid lines) are plotted vs. their rank order (N) within the SVD. Open symbols with dashed lines represent one-sided P-values (PF) for the F-statistic that compares a rank N approximation of the data matrix with the rank N-1 approximation. (A) Simulated fluorescence data. (B) Fluorescence spectra from the RXRα denaturation. (C) CD spectra from the RXRα denaturation.