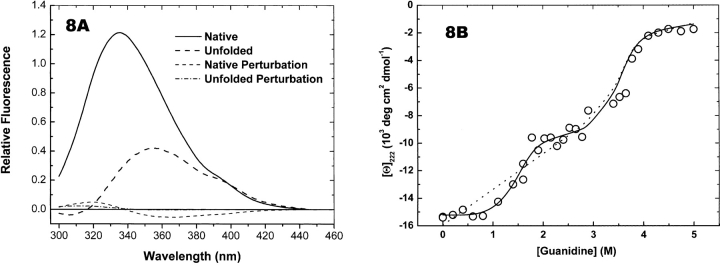
Figure 8.
Comparing two-state and three-state fits to RXRα titration data. (A) Fluorescence spectra recovered from fitting a two-state model. (B) Circles are CD ellipticities measured at 222 nm (from Fig. 4B ▶). Ellipticities were reconstructed using median estimates of the thermodynamic parameters (see Table 2) and transformed data (S • VT) for a three-state model (solid curve). The dashed curve shows ellipticities reconstructed from fitting a two-state model.

