
Figure 9.
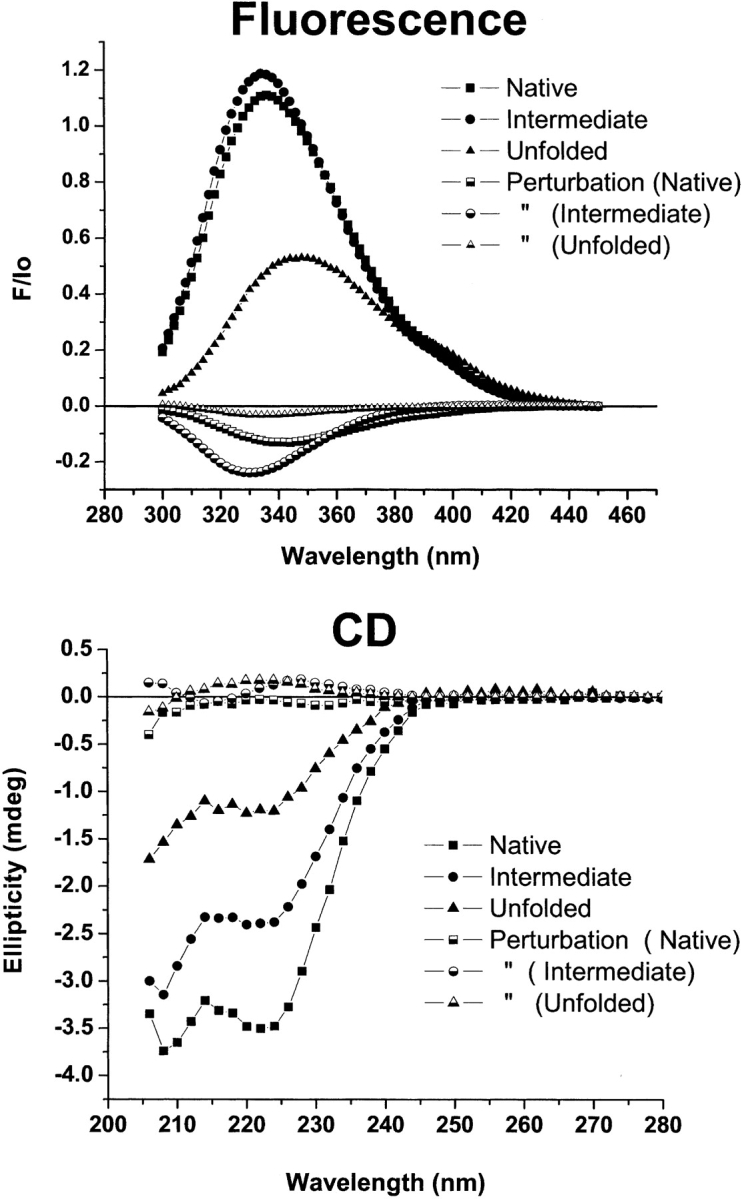
Species and perturbation spectra from fitting RXRα with the three-state model. Species and perturbation spectra from fitting RXRα titrations were reconstructed using median estimates of the thermodynamic parameters (Table 2) and transformed data. Filled symbols are species spectra. Half-filled symbols are corresponding perturbation spectra. (Top) Fluorescence spectra. (Bottom) CD spectra.