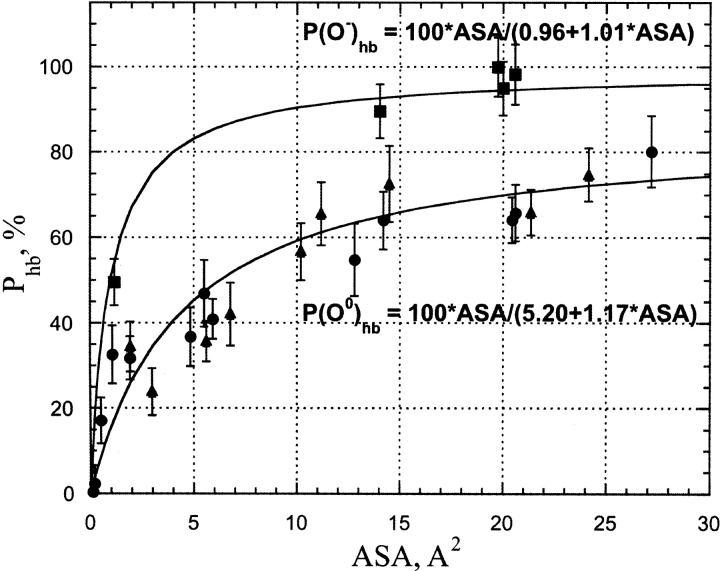
Figure 4.
The correlation between per H-bond probability of the water–protein hydrogen bond and accessible surface area for protein carbonyl, hydroxyl, and carboxyl oxygen atoms as derived from MD simulations of Crambin in an explicit water box. The filled circles and triangles show uncharged main-chain carbonyl and side-chain hydroxyl groups, respectively, where oxygen atoms are involved in water–protein hydrogen bonding. The filled squares show charged carboxyl oxygen atoms in side-chain Asp and Glu involved in water–protein H-bonds. In all cases only the data for atoms without possibilities of water bridge formation were shown. The parameters of the approximation function are shown in the figure.

