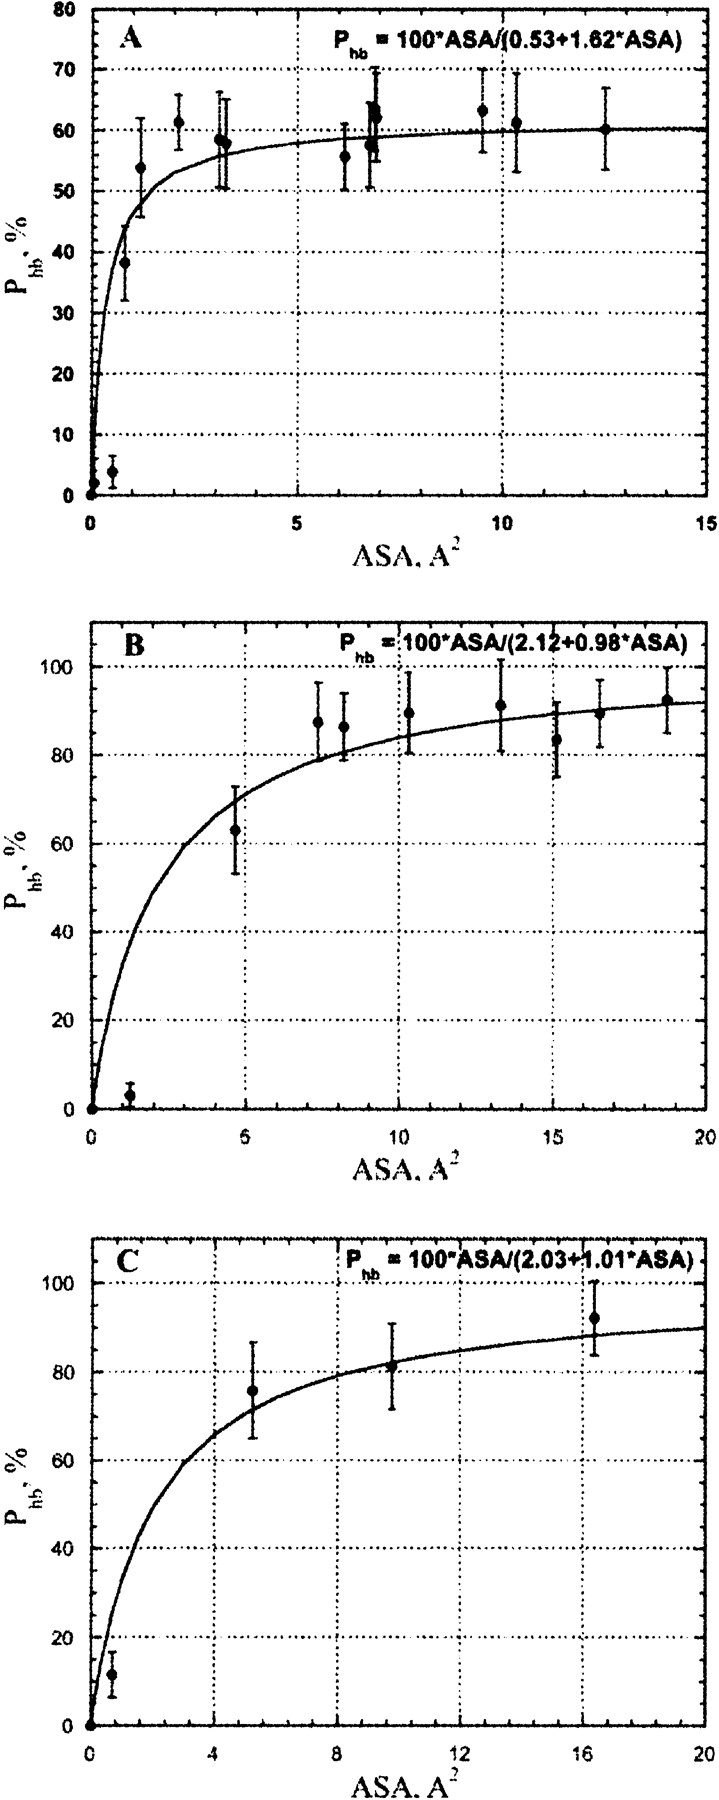
Figure 5.

The correlation between an H-bond probability of water–protein hydrogen bond and accessible surface area for hydrogen atoms in (A) uncharged NH, NH2 in protein main and side chains; (B) uncharged OH groups in side chains Ser and Thr; (C) charged NH2+ and NH3+ groups as derived from MD simulations of Crambin in an explicit water box. The accessible surface was calculated with explicit hydrogen atoms.
