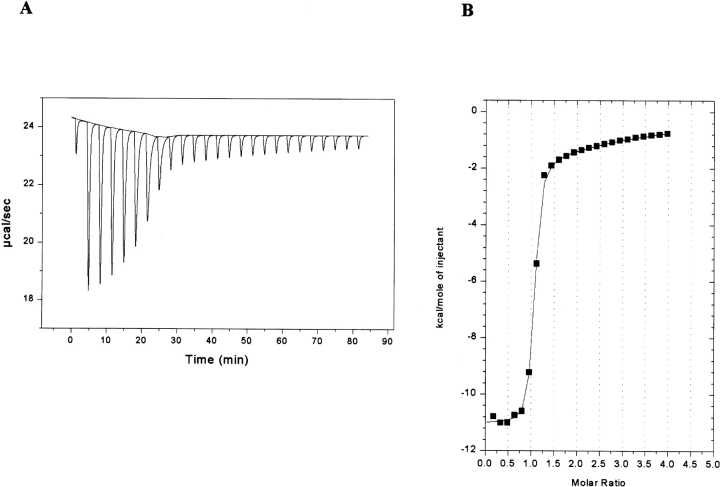
Figure 4.
ITC analysis of Ni2+ binding by the wild-type DHQS domain. (A) Raw data showing the heat pulses resulting from a titration of metal free wild-type DHQS domain (93 μM) in the calorimetric cell with a 2-μL injection of 2 mM Ni2+ followed by 24 subsequent 10-μL injections. (B) Integrated heat pulses, normalized per mole of injectant, giving a differential binding curve that is adequately described by a two-site sequential binding model.

