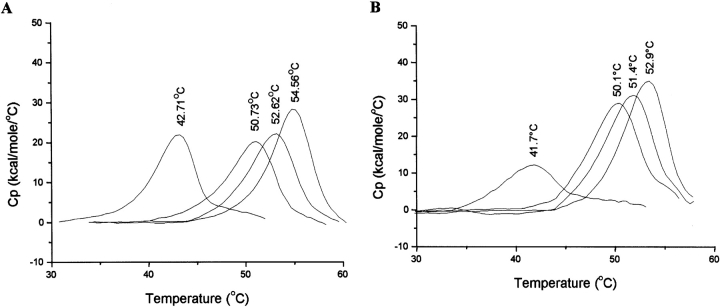
Figure 6.
DSC analysis of the ligand binding ability of wild-type and mutant DHQS domains. DSC data comparing the thermal unfolding transitions of the wild-type (A) and R130K (B) mutant DHQS domains in the presence of the ligands Zn2+, DAHP, and NAD+. Heat capacity data are corrected for instrumental (buffer) baseline and concentration normalized (1 cal = 4.184 J). In each case the order of the thermal transitions from left to right is unliganded DHQS, DHQS plus Zn2+ (40 μM), DHQS plus DAHP (1 mM), and DHQS plus NAD+(1 mM). The Tm for each transition is shown at the apex of each peak.

