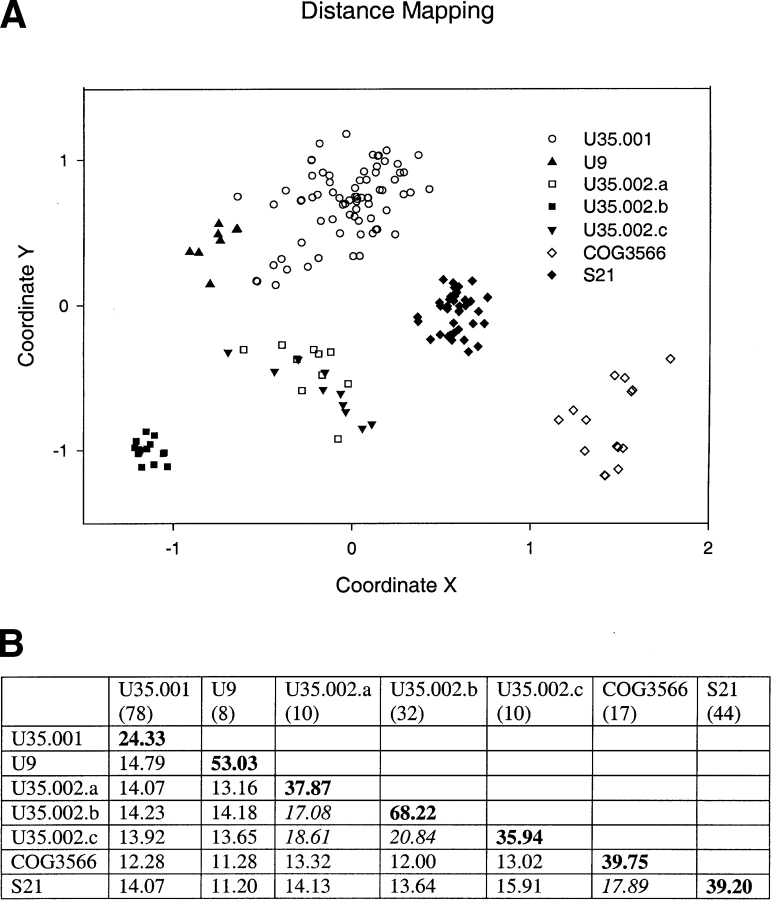
Figure 2.
Euclidian distance mapping and sequence identities. (A) Euclidian distance mapping. This diagram is a two-dimensional projection of a multidimensional Euclidian space with X and Y-axes selected for best visualization effect. Different families or subfamilies are represented by various symbols. (B) Average pairwise sequence identities (percent) within and between families. Shown in bold are within-group identities of a family or a subfamily. Shown in italic are between-group identities >17%. The number in parentheses under each family name is the number of sequences in that family.

