
Figure 3.
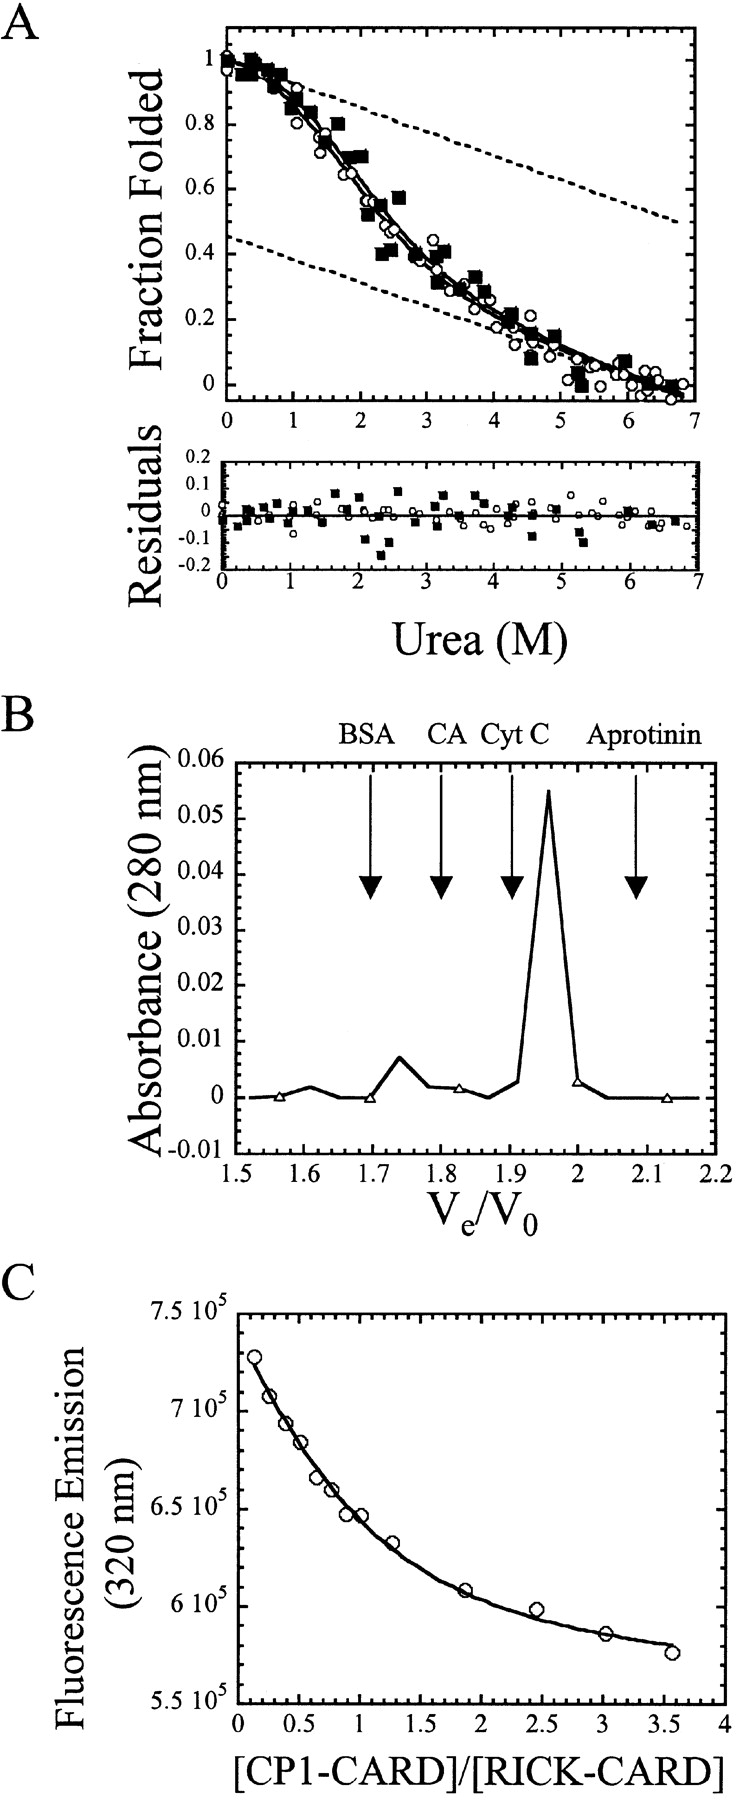
(A) Equilibrium folding/unfolding of CP1-CARD. The normalized CD (filled squares) and fluorescence emission data (open circles) are plotted vs. urea concentration. The protein concentration was 6 μM. The solid lines represent global fits of the data to a two-state equilibrium folding mechanism, as described in the text. The ΔGH2O and m-value obtained from the global fits are 1.1 kcal/mole and 0.65 kcal/mole/M, respectively. The residuals of the fits are shown in the lower panel. The dashed lines represent the native and unfolded baselines. (B) Analytical size exclusion chromatography of CP1-CARD. The absorbance of CP1-CARD (open triangles) is plotted vs. the elution volume. The arrows indicate the elution volumes of the standards, including bovine serum albumin (BSA), carbonic anhydrase (CA), cytochrome c (Cyt C), and aprotinin. (C) Binding of CP1-CARD with RICK-CARD. Samples were excited at 295 nm, and the fluorescence emission at 330 nm (open circles) is plotted vs. the ratio of CP1-CARD to RICK-CARD. The solid line represents a fit of the data to equation 3, as described in Materials and Methods.