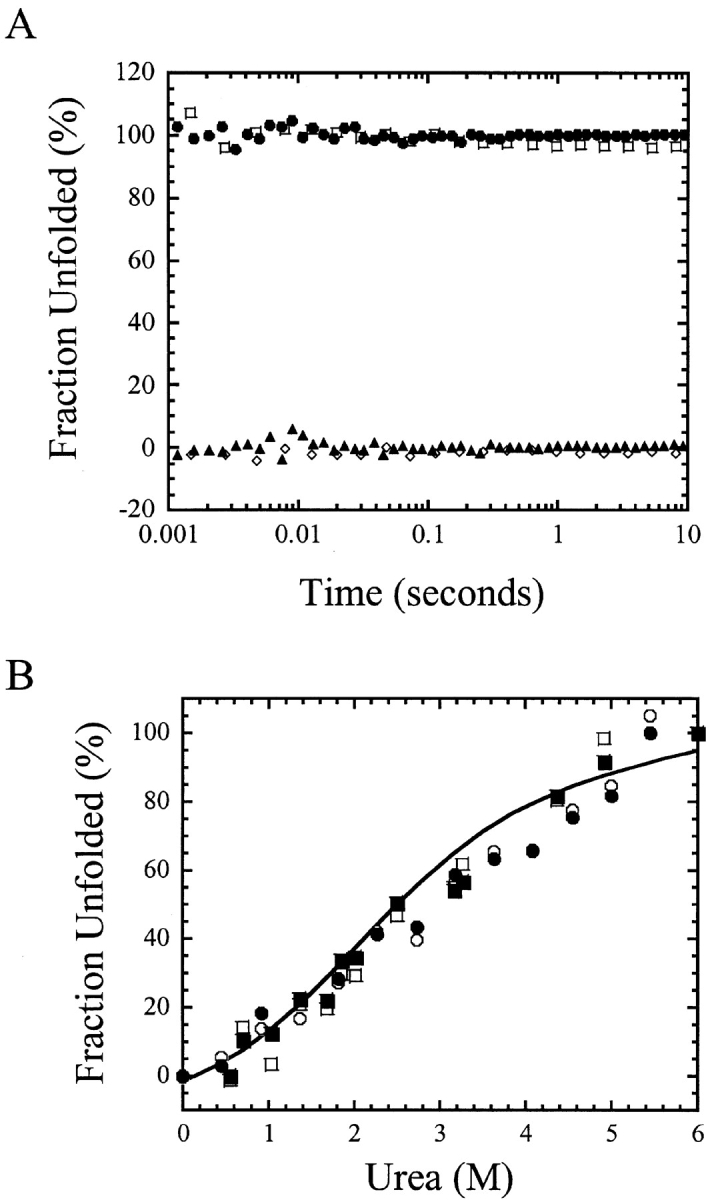
Figure 4.

(A) Unfolding (filled circles) and refolding (filled triangles) kinetic traces of CP1-CARD. The signals are normalized to the fraction of unfolded protein. The native (open diamond) and unfolded (open square) protein signals are indicated. (B) The signals of unfolding and of refolding vs. urea concentrations. The initial (open circles, 10 msec) and final (filled circles, 10 sec) signals of unfolding are shown. The initial (open squares, 10 msec) and final (filled squares, 10 sec) signals of refolding are shown as well. The solid line represents the fit of the equilibrium data shown in Figure 3A ▶.
