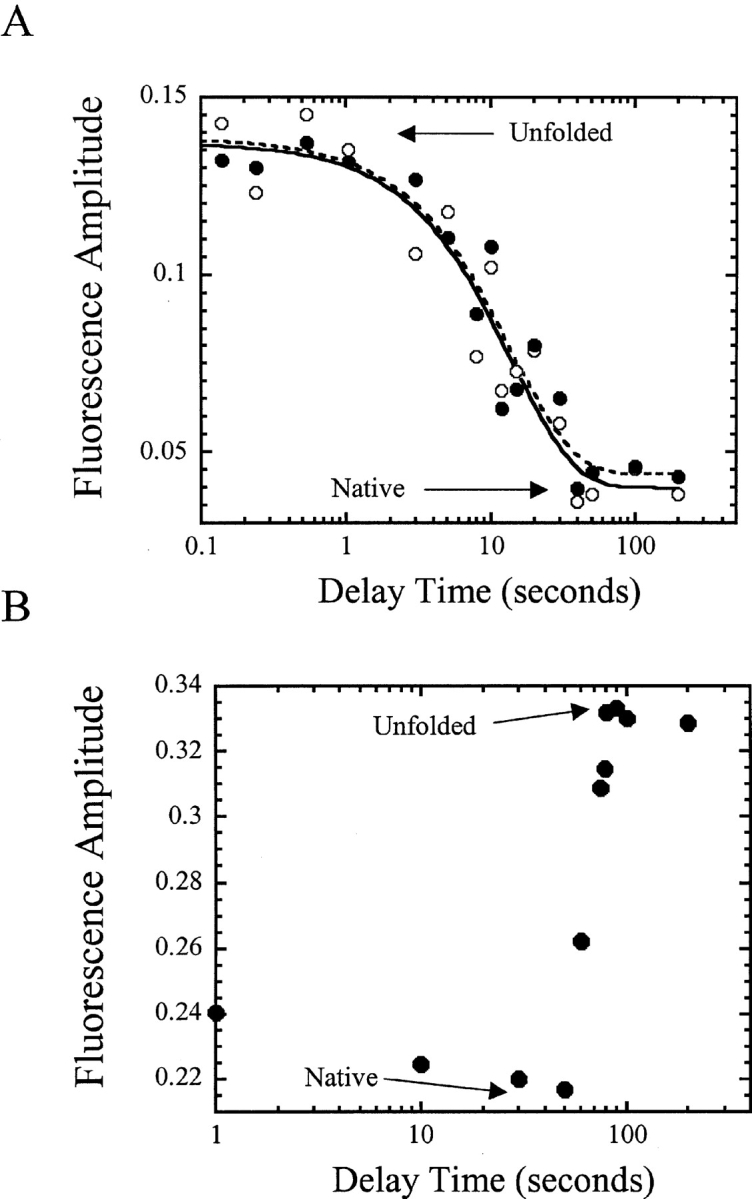
Figure 5.

(A) Fluorescence amplitude vs. delay time in double jump experiments. The initial (open circles) and final (filled circles) signals of the traces are plotted vs. delay time. The lines represent fits of the initial (solid line) and final (dashed line) signals to a single exponential equation, as described in the text. (B) Fluorescence amplitude vs. delay time in interrupted refolding experiments. For both A and B, the signals of unfolded and of native protein are indicated.
