Figure 3.

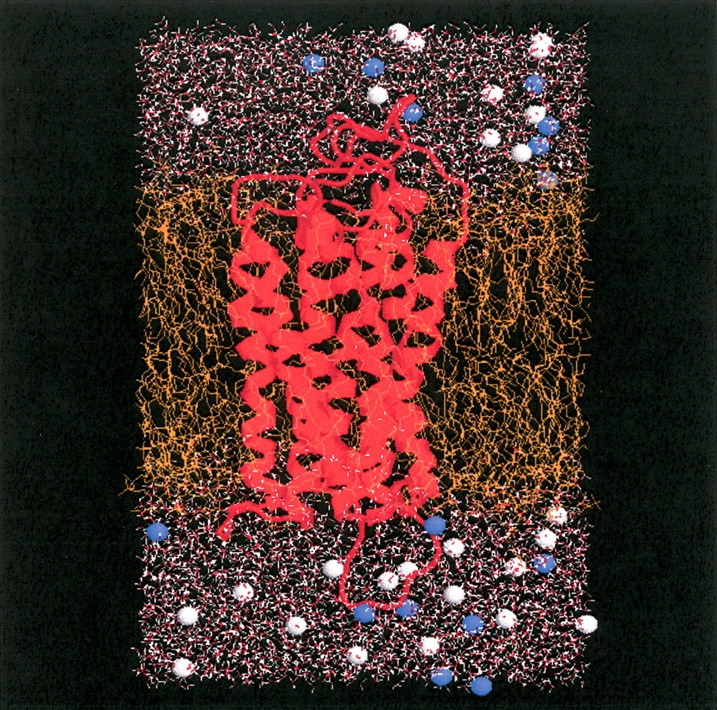
The starting configuration for the simulation of the hDOR in a lipid bilayer. The receptor is displayed as red ribbons, the POPC lipids are in orange, water is in red/white, and the blue/gray spheres indicate sodium or chloride ions.

The starting configuration for the simulation of the hDOR in a lipid bilayer. The receptor is displayed as red ribbons, the POPC lipids are in orange, water is in red/white, and the blue/gray spheres indicate sodium or chloride ions.