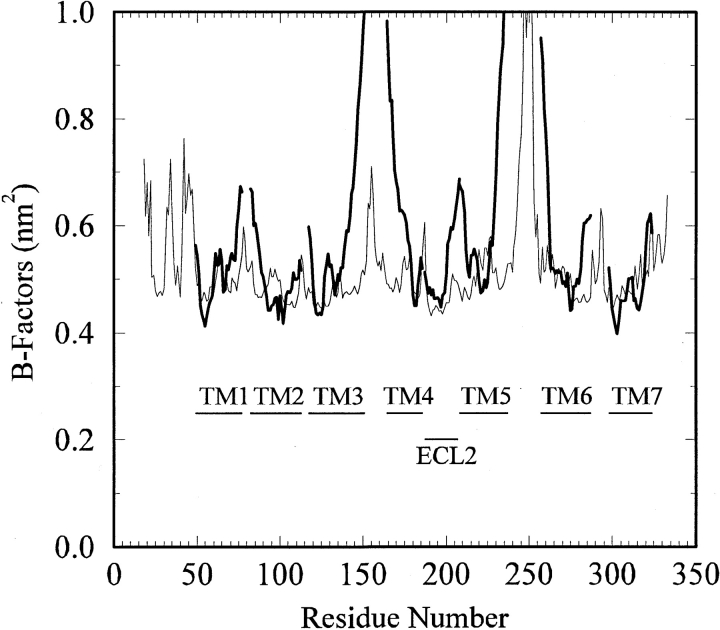
Figure 8.
B-factors for the Cα atoms obtained from the simulation (thin line) compared with the corresponding residues (TM1–7 and ECL2) for bovine rhodopsin (thick lines). The residue numbering system corresponds to that of the hDOR. The simulated data were determined after averaging over the final 10 nsec of the simulation and has been offset by 0.4 nm2 to counter the large static disorder contribution contained in the rhodopsin data.

