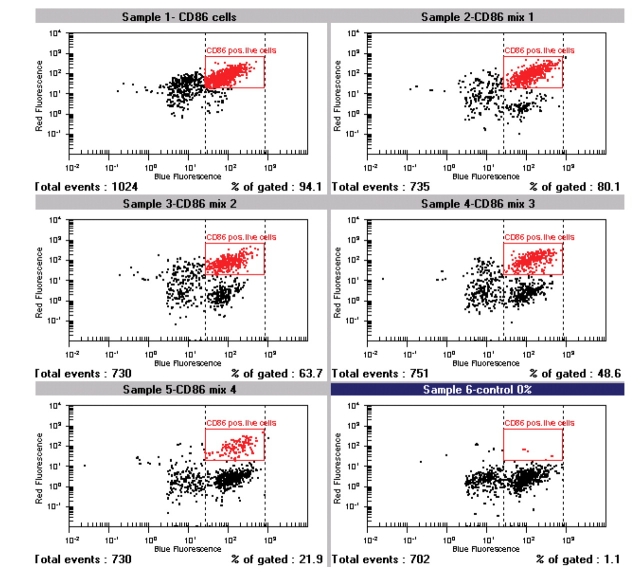
FIGURE 2.
On-chip antibody staining results are displayed as dot plots for all six samples. Each dot represents one cell displayed at two fluorescent values on logarithmic scale. Red region marks double positive cell population. The 293 cells and a CD86 expressing cell clone were harvested and washed and cell density was adjusted to 3 million cells per milliliter in an isobuoyant cell buffer. Positive and negative control (sample 1 and 6) and four mixtures of parental and transfected cells were prepared at different ratios. Ten microliters of cell suspension were incubated with calcein-AM and anti hCD86-APC antibody (prediluted in 1:8 in CB) directly in the chip wells.

