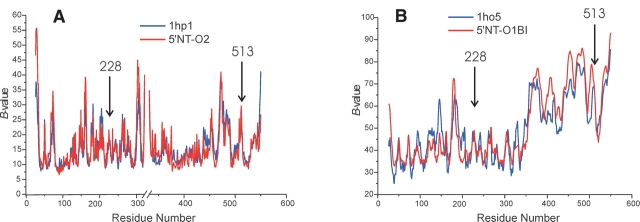
Figure 6.
Comparison of B-values. (A) Open form of wt 5′-NT (PDB ID 1hp1) and 5′NT–O2. The interruption of the X-axis is due to missing residues in the structures. The B-value distribution of 5′NT–O2 has been scaled by a factor of 1.9 to that of 1hp1. (B) Closed form of wt 5′-NT (PDB ID 1ho5, chain B) and 5′NT–O2B.

