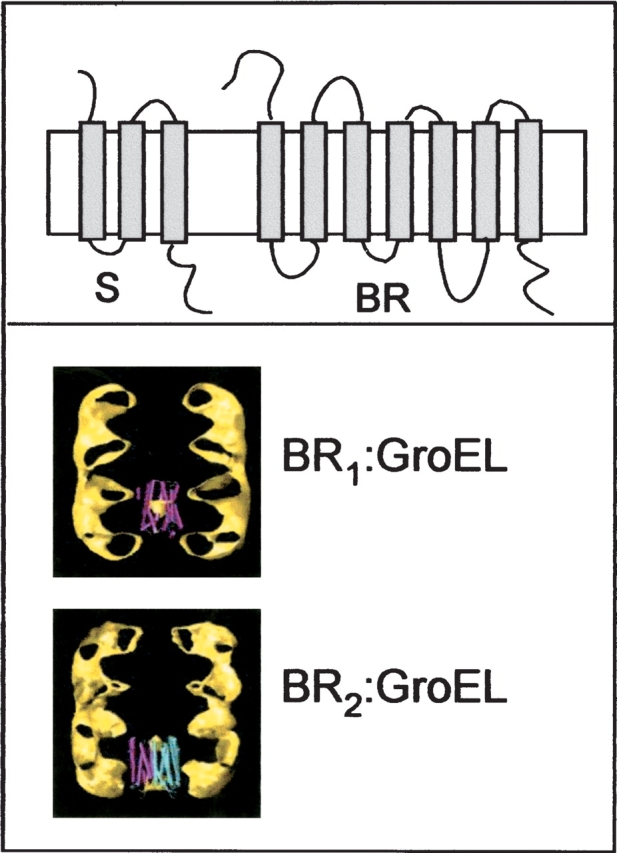
Figure 1.

S gene products and BR: topologies and scale compared to GroEL. (Upper panel) Topological model of the S proteins (S105 and S107), with three TMDs, and BR, with seven TMDs. (Lower panel) Modeled images of complexes formed between one or two molecules of BR and the structure of GroEL.
