
Figure 5.
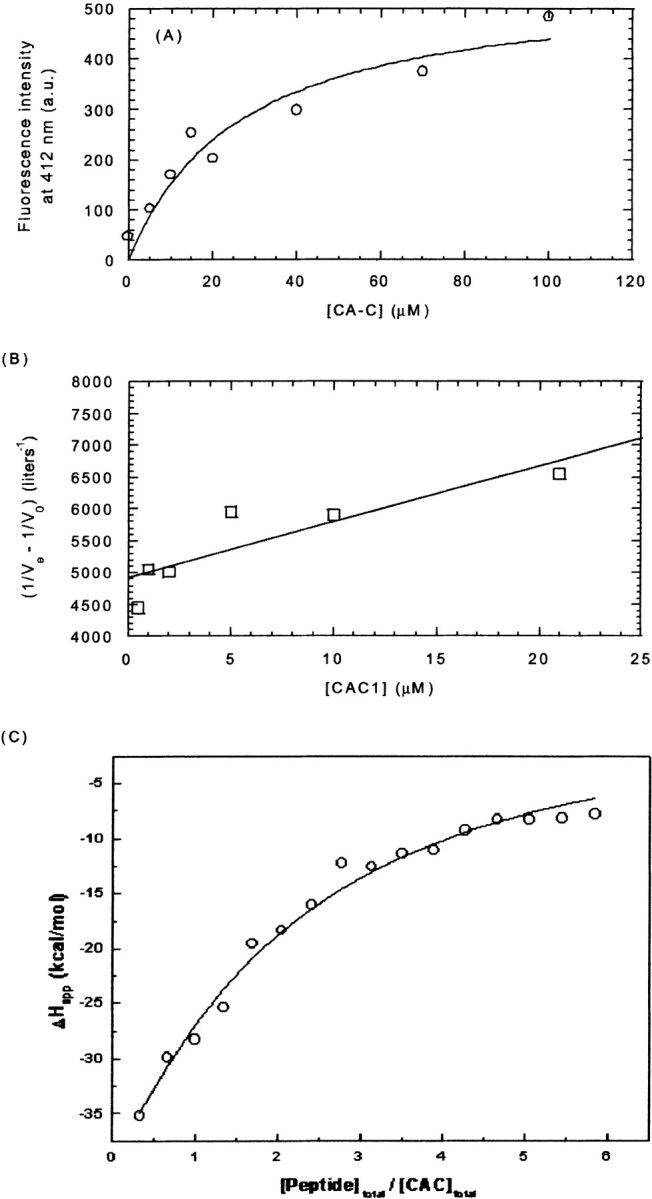
Binding of CAC1 to CA-C. (A) Steady-state fluorescence of the anthraniloyl-labeled CAC1 upon addition of increasing amounts of CA-C, by excitation at 320 and observation at 420 nm (a similar curve was observed by excitation at 246 nm). The value obtained for the dissociation constant was 30 ± 10 μM. (B) Affinity chromatography. The value obtained for the dissociation constant was 43 ± 2 μM. (C) ITC isotherm. The value obtained for the dissociation constant was 79 ± 7 μM. The conditions in all cases were phosphate buffer (pH 7.3), 25 mM, at 298 K. The lines represent the fitting to equation 1 for the fluorescence data (a similar curve was obtained by using equation 2), to equation 5 for the affinity chromatography results, and to the equation included with the Microcal software for a single-site model with a complex 1:1 stoichiometry (ITC data).