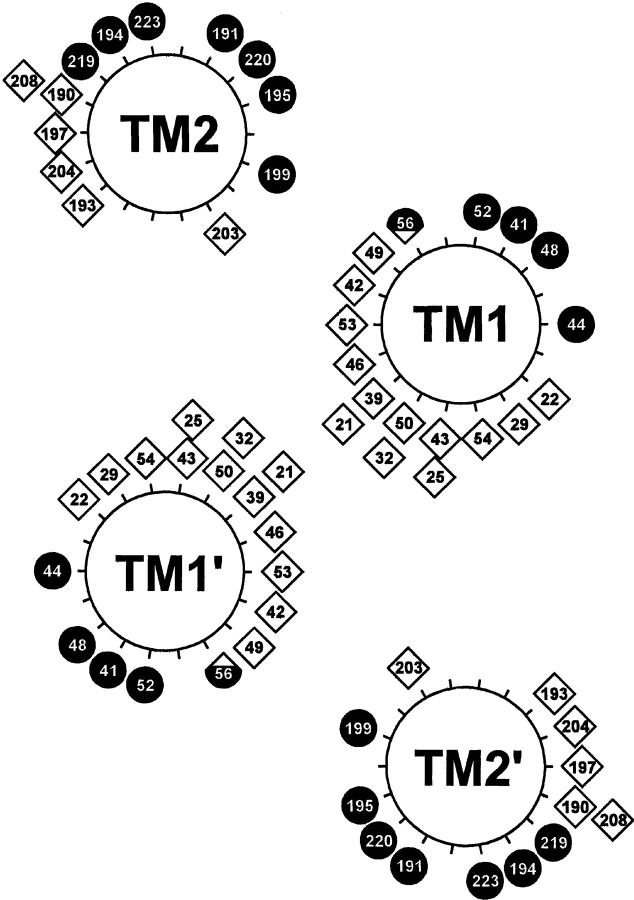
Figure 5.
Distribution of maxima for accessibility and cross-linking. Local maxima for accessibility from Fig. 3 ▶ and for cross-linking from Fig. 4 ▶ are displayed as filled circles and open diamonds, respectively, on the helical wheel diagram in the model of the Trg transmembrane domain derived from comprehensive analysis of previous cross-linking data (Lee and Hazelbauer 1995). The local maximum for position 48, which is bracketed by two negatively charged residues, represents high accessibility to an uncharged sulfhydryl reagent, not the lower accessibility for a bulky, charged reagent plotted in Fig. 3A ▶ (see text). The hybrid symbol for position 56 reflects local maxima for both cross-linking and accessibility, created by a bulge in helical packing (see text).

