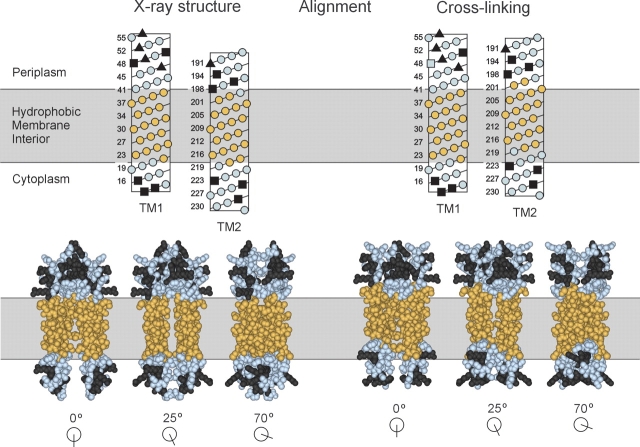
Figure 6.
Alignment of TM1 and TM2. Positions in TM1 and TM2 exhibiting minimal accessibility to 5-IAF (Fig. 3 ▶) are shown in gold, and positions outside this region are in blue. Charged residues, all of which are outside the region of minimal accessibility, are in dark gray. In the upper panel, sequences of the TM1 and TM2 regions are displayed in helical net diagrams and aligned along their long axes by two independent criteria. (Left) Extension of the homology model based on the X-ray structure of the periplasmic domain of chemoreceptor Tar (Milburn et al. 1991; Peach et al. 2002). (Right) Alignment by patterns of oxidative cross-linking between introduced cysteines (Lee et al. 1994; Hughson et al. 1997; Peach et al. 2002). The two alignments are placed relative to the membrane so that in each the minimally accessible positions in TM1 are all in the hydrophobic interior. The lower panel presents three space-filling views of the two alignments based on models of the entire transmembrane domain of Trg (Milburn et al. 1991; Peach et al. 2002). The models include TM1/TM1′ residues 13–56 and TM2/TM2′ residues 188–229.

