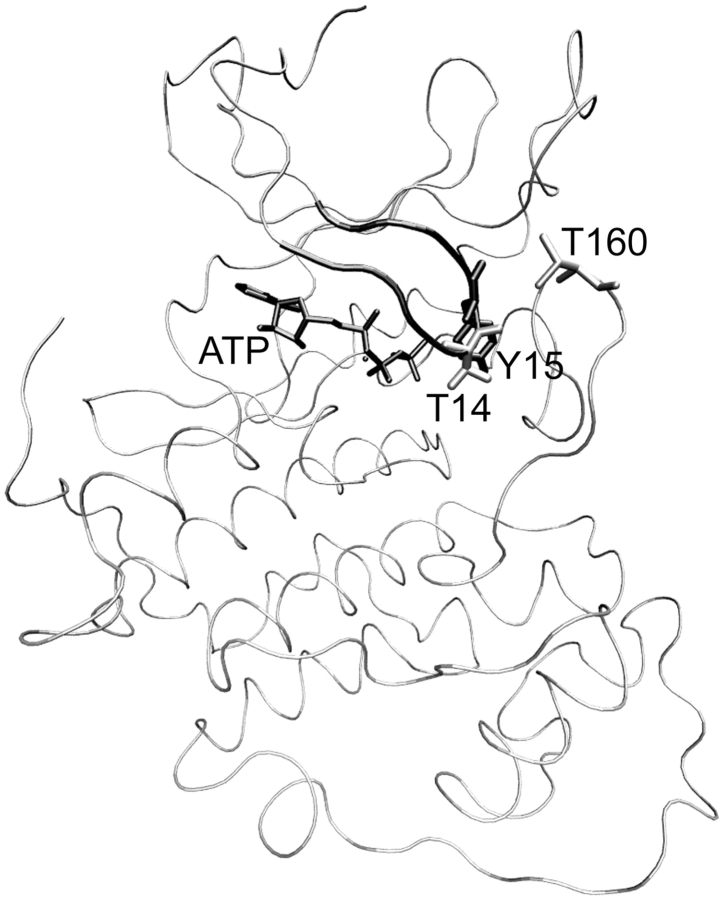
Figure 1.
View of CDK2/ATP (1HCK coordinates taken from PDB database) complex is shown in tube representation. The T160 (shown in gray-colored licorice representation) activation site is located on the T-loop. The G-loop (black-colored tube representation) includes two possible inhibitory sites, T14 (gray-colored licorice representation) and Y15 (black-colored licorice representation).

