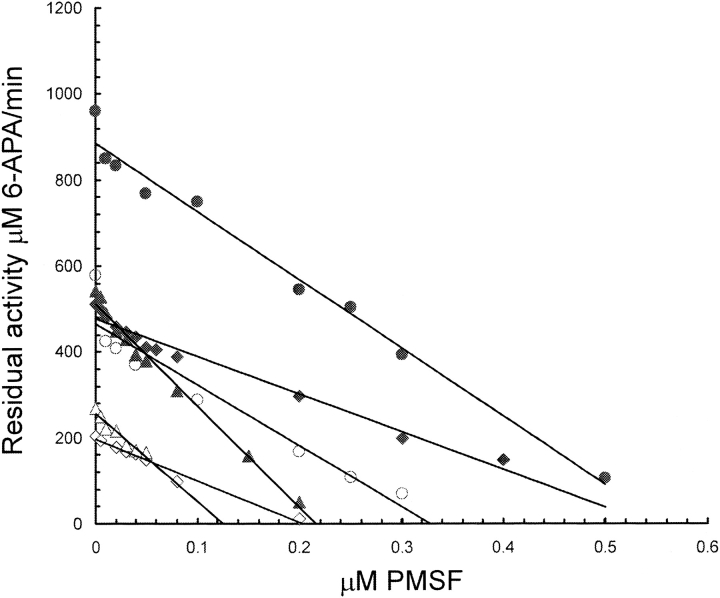
Figure 3.
Plot of residual PGA activity vs. PMSF inhibitor concentration. The open and closed symbols indicate different concentration of protein used during the inhibition assays (enzyme concentration values are shown in Table 2). The slope of the parallel lines was taken as the kcat and the line intersection with the abscissa indicates the active site molar concentration. Circles, diamonds, and triangles correspond to PGA-WT, DPAG, and NEGM data, respectively.

