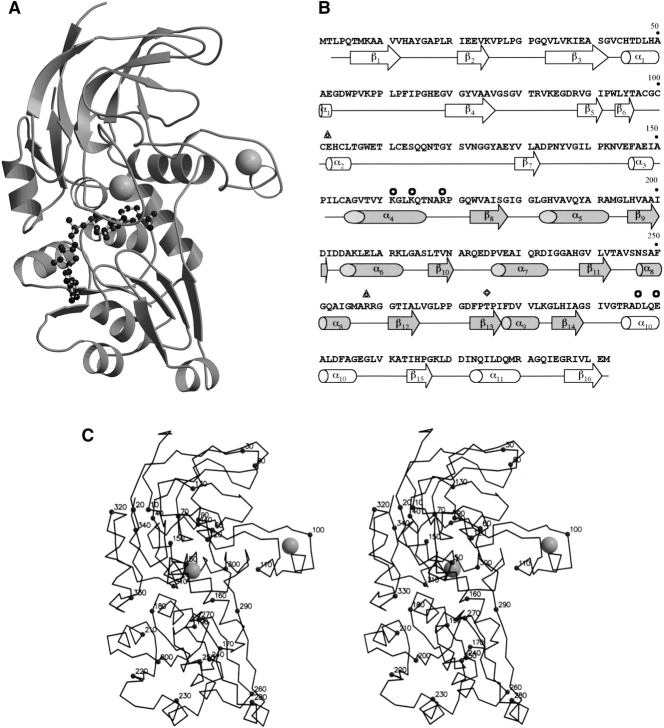
Figure 1.
(A) The ribbon model of PaADH monomer. The coenzyme is shown in balls and sticks. Catalytic and structural Zn2+ are shown as gray balls. (B) The amino acid sequence and the secondary structure of PaADH. Secondary structure elements are shown in white for the catalytic domain and in gray for the coenzyme-binding domain. Residues participating in the intersubunit interactions are labeled by circles for a five-member ion-pair network between subunits A and D, by triangles for a single ion pair between subunits A and B, and by a rhomb for Thr 275 participating in the A–B interaction. (C) Stereo view of the PaADH Cα trace. Every tenth residue is labeled by a full sphere.

