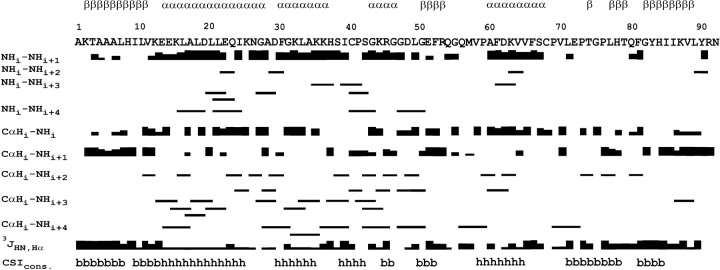
Figure 2.
Secondary structure indicators for E. coli Par10. Existence and intensity of typical NOEs are symbolized by the corresponding black rectangles, likewise the size of the 3J coupling. The last row shows the results of the Chemical Shift Index, CSI (Wishart et al. 1992; Wishart and Sykes 1994), with the letters b and h denoting β-sheets and helices. For comparison, the secondary structure element locations of the final structural ensemble are given on top of the sequence.

