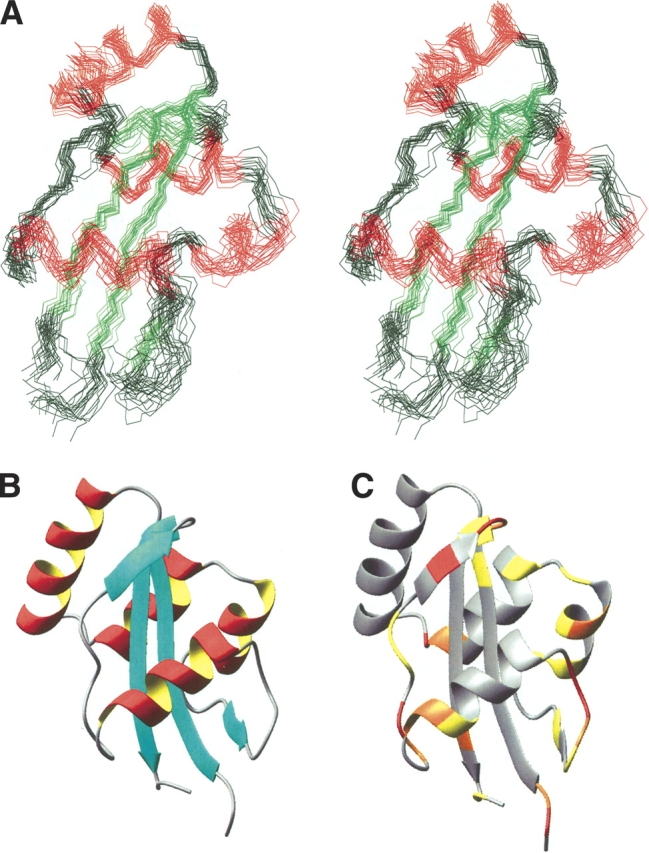
Figure 4.

Three-dimensional structure of E. coli Par10. (A) Stereoview of the ensemble of the 18 best structures calculated from NMR data. The structures are superimposed with respect to the backbone atoms of secondary structure elements (excluding helix 3). For easier orientation, the antiparallel β-sheet is colored in green, the four helices in red. (B) Cartoon representation of the E. coli Par10 structure with secondary structure elements. (C) Tertiary structure of E. coli Par10 color-coded according to the MEXICO data: red, fast exchange; orange, medium exchange; yellow, weak exchange of the NH protons on a 100-ms time scale. Figure produced with MOLMOL, version 2k.1 (Koradi et al. 1996).
