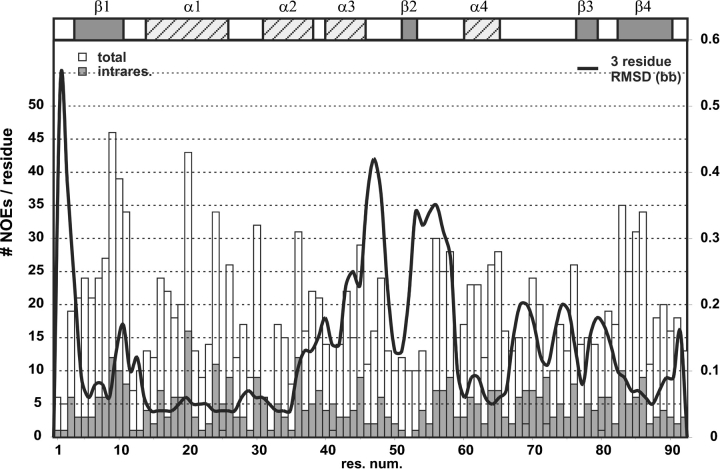
Figure 5.
Local RMSD values and number of NOEs per residue: although the NOE density is almost evenly distributed over the length of the sequence, significant differences can be seen in the local RMSD (black line). While most secondary structure elements (indicated in the top row) are well-defined, helix α3 and the two following loop regions show a high local RMSD that can be attributed to local flexibility.

