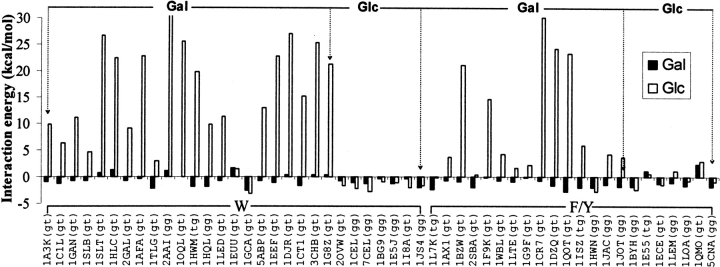
Figure 5.
Bar diagram showing the interaction energies of the glucose–aromatic residue analog complexes (open bars). The interaction energies of the galactose–aromatic residue analog complexes corresponding to the same position-orientation are shown alongside (filled bars; same data as that in Fig. 4A ▶) for comparison. The position-orientations as identified by the corresponding PDB IDs are shown along the X-axis; the rotamer of the —CH2OH group observed in the saccharide (glucose or galactose)–protein complex is shown in parentheses after the PDB ID. The bound saccharide (Gal or Glc) in the crystal structure is indicated above the bars; the aromatic residue in the binding site is indicated below the bars by the single-letter amino acid symbol.

