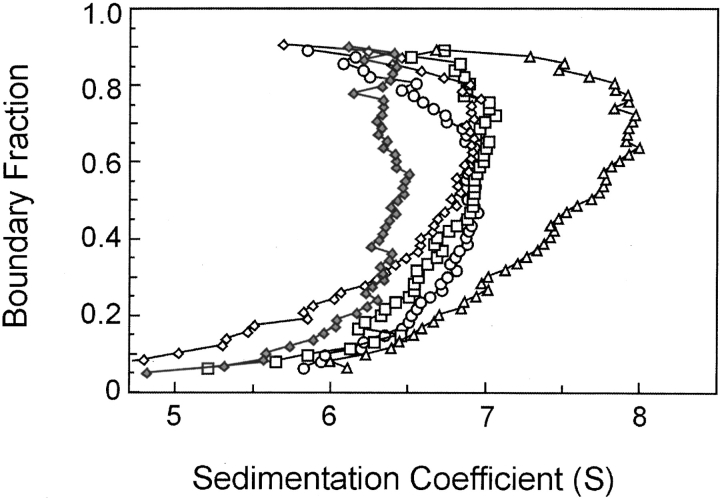
Figure 5.
Sedimentation velocity centrifugation of various species of SecA and SecB in complex. Distribution plots as described in legend to Fig. 3C ▶ for analyses of SecAN880 only (filled diamonds), SecA and SecB (triangles), SecA and SecBL75Q (open diamonds), SecAN880 and SecB (squares), SecAC98SC887S and SecB (circles). All proteins were present at 3 μM. The distribution of s values is not shown for SecA, but it was indistinguishable from that of SecAN880. SecAC98SC887S had a distribution centered around 5.9 S, indicating that the alterations increase the monomer–dimer equilibrium constant.

