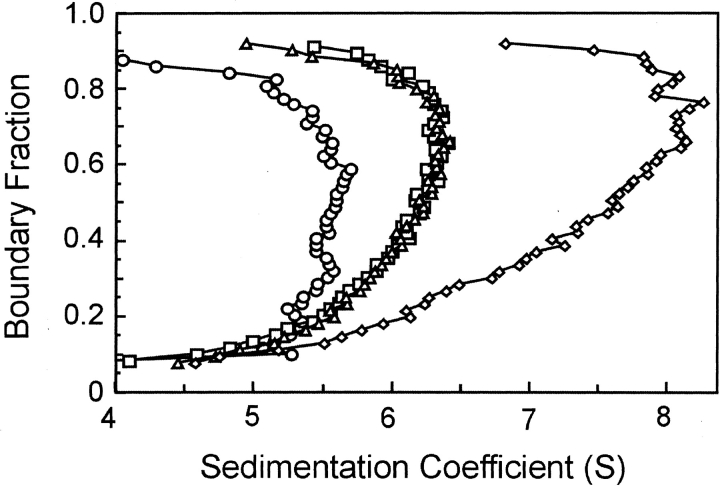
Figure 6.
Effect of C-terminal peptide of SecA on wild-type complex of SecA and SecB. Distribution plots of s values for SecA only at 3 μM (circles), a mixture of SecA and SecB at 3 μM (diamonds), SecA and SecB with addition of SecA C-terminal 21 amino acid peptide and Zn2+ (24 μM each; squares), and addition of 1 mM EDTA to SecA, SecB, peptide and Zn2+ (triangles). See text for details.

