
Figure 4.
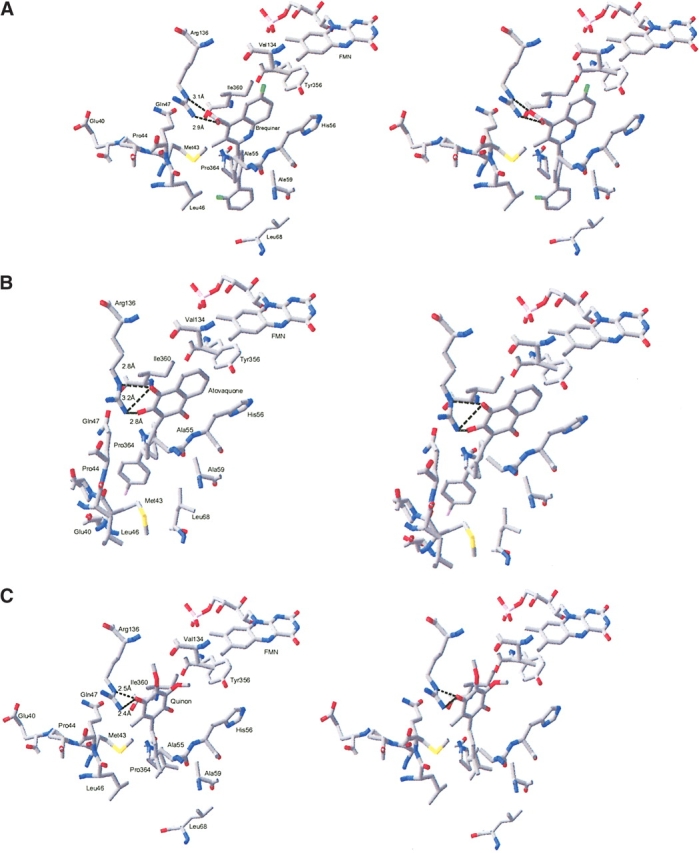

Stereo diagrams showing the inhibitor and substrate binding sites in the class 2 DHODs. (A) Brequinar binding site. Residues Ala 55, Leu 46, and Ile 360, which make hydrophobic contacts to brequinar, are not shown in the picture. (B) Atovaquone binding site. Residues His 56, Val 134, and Met 43 are not shown in the picture. (C) Modeled binding of the quinone substrate to DHODR. Nitrogen atoms are shown in blue; oxygen, in red; and fluoride, in green. The distances given are in Ångstroms. (D) The DHODC with an empty inhibitor site seen in the same view as the DHODR. The figures are produced by Swiss PDB-Viewer (Guex and Peitsch 1997).