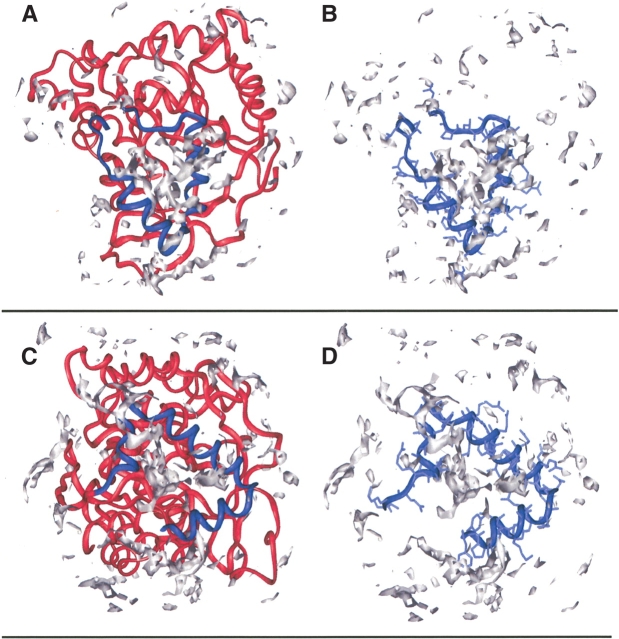
Figure 5.
Hydrophobic probes in DHODR and DHODC. The probes for DHODR are shown in Figure 5A and for DHODC in Figure 5C. A more detailed picture of only the small N-terminal domain with side chains is shown for DHODR in Figure 5B and for DHODC in Figure 5D. The small N-terminal domain is colored in blue, and the rest of the protein, in red. Hydrophobic probes are colored in gray. The hydrophobic probes are calculated by GRID (version 21, Molecular Discovery Ltd.; Goodford 1985) and the pictures are produced using Insight II (97.0; Biosym/MSI).

