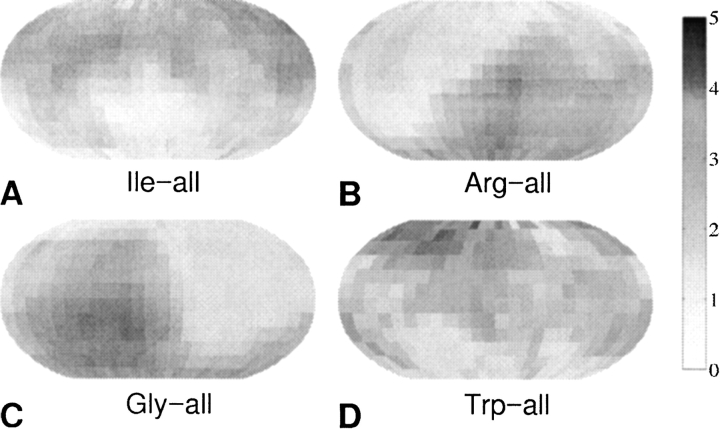
Figure 1.
Examples of probability density maps for the relative residue–residue orientations in proteins for short range interactions (2.0→5.6 Å). The grayscale mapping is directly proportional to the probabilities of finding any other side chain at various orientations with respect to Ile (A), Arg (B), Gly (C), and Trp (D). The normalized probability values shown on the grayscale scale have units of 10−3.

