
Figure 10.
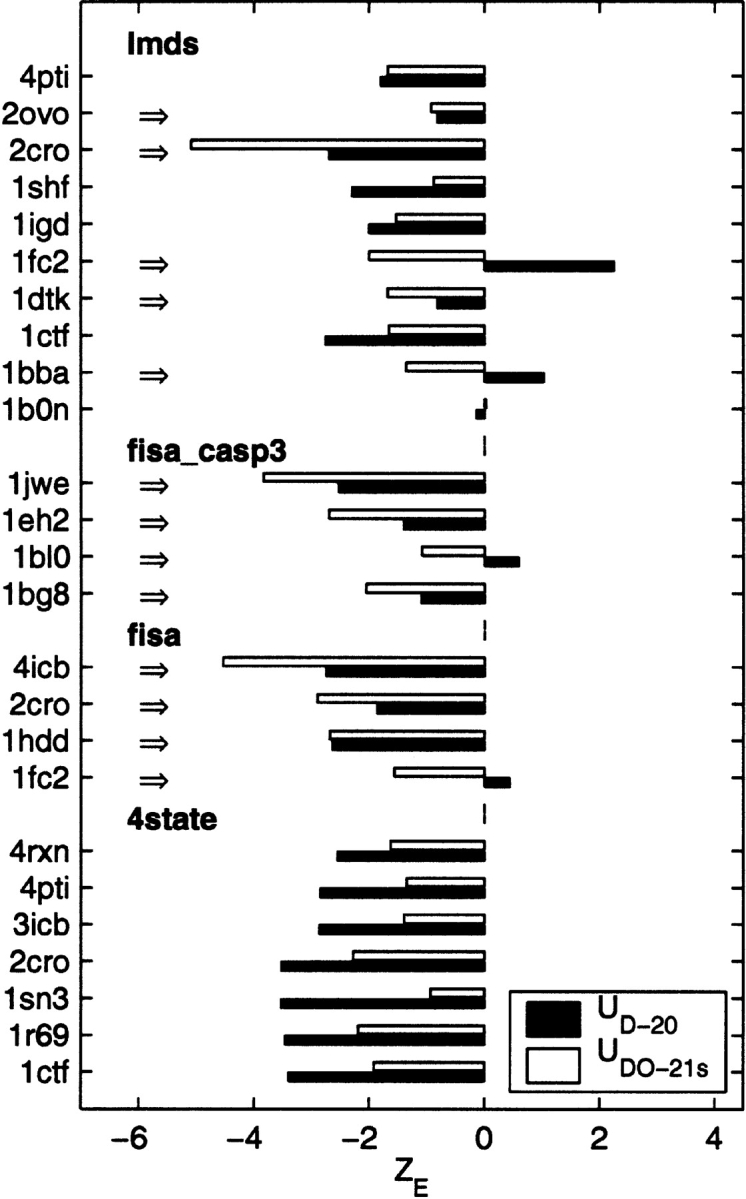
Comparison of ZE scores for multiple decoy sets (Samudrala and Levitt 2000). The cases in which the smooth, distance- and orientation- dependent potentials (UDO–21s, white bars) perform better than potentials depending solely on distances (UD–20, black) in discriminating the native state from decoys are emphasized by the arrows on the left.