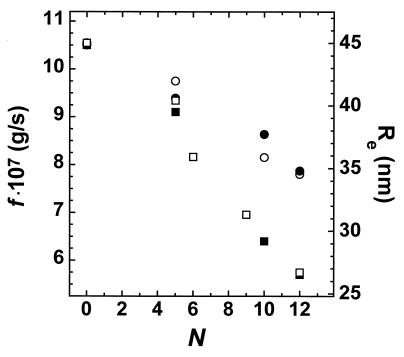
Figure 1.
Changes in the f and Redil of H3/H4 tetramer arrays and nucleosomal arrays as a function of 208-12 DNA saturation. Sedimentation velocity experiments were performed in TE buffer and quantitative agarose gel electrophoresis experiments in E buffer. The f was calculated from the s20,w in TE by using standard procedures (41). The f and Redil of H3/H4 tetramer arrays are indicated by the closed circles and open circles, respectively, whereas the f and Redil of nucleosomal arrays are indicated by closed and open squares, respectively.

