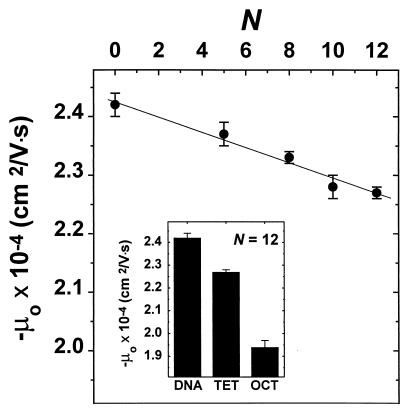
Figure 2.
Changes in the mo of H3/H4 tetramer arrays in E buffer as a function of 208-12 DNA saturation. Data points represent the mean ± 1 SD of three to four determinations. The Inset shows the μo of naked 208-12 DNA (DNA) (24), trypsinized nucleosomal arrays (TRP) (33), H3/H4 tetramer arrays (TET), and nucleosomal arrays (OCT) (24).

