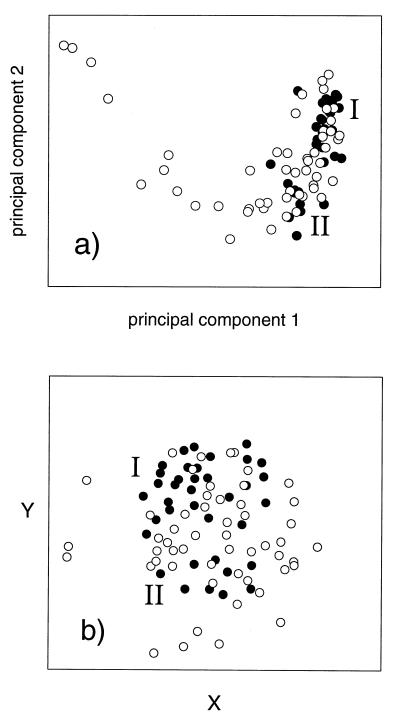
Figure 3.
Projections of the peptide distributions in physicochemical space by principal component analysis (a) and nonlinear mapping (b). Black circles represent active peptides, and open circles represent inactive peptides. Activity was measured by ELISA. Two adjacent clusters of active peptides are labeled I and II.

