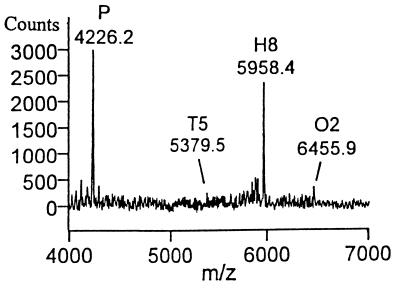
Figure 5.
MALDI MS spectrum of O2 digestion with the heparinase II C348A mutant. The figure represents the product profile after 120 min of digestion. A control of wild-type recombinant heparinase II was run at the same time. Its product profile at 120 min is identical to that in Fig. 4C.

